Publisert
06. okt. 2025

Artikkelen er flere år gammel

Credit markets update:
The Nordic HY primary market has been unusually active this year, with YTD issuance exceeding NOK 225 billion.

The Nordic HY primary market has been unusually active this year, with YTD issuance exceeding NOK 225bn and already surpassing previous full-year records. Most deals have performed well after the break, but a visible tail of underperformers has emerged, suggesting that certain segments were priced too tightly. This report examines the details behind this year’s issuance and post-settlement performance. We find that large EUR deals from debut issuers have shown a greater tendency to trade down after settlement, while other segments have generally performed well. The results highlight the importance of investor selectivity, disciplined pricing and robust bookbuilding.
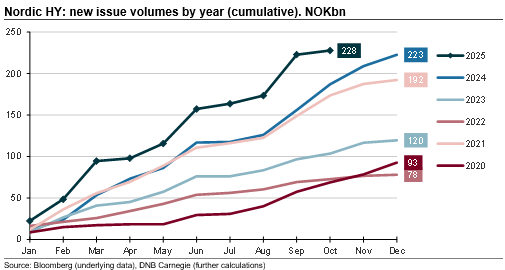
The Nordic HY market has been surprisingly active this year, with primary market volumes already surpassing previous full-year records. As of early October, new issue volume has reached NOK 225bn, slightly ahead of the NOK 223bn placed in all of 2024.
In total, there have been 190 issues including taps. Average deal size has also increased, reaching NOK 1.4 billion so far this year (excluding taps. A tap is a reopening of an existing bond issue, where the issuer sells additional bonds under the same terms (coupon, maturity, etc.) as the original issue), compared with NOK 1.1 billion in 2024. New issue spreads remain elevated at 529bps for all 2025 deals, versus 515bps last year. This partly reflects the heavy supply, which allows investors to turn down transactions, but also that many of the recent issues have been characterised by higher risk profiles.
To investigate this further, we have tested how this year’s Nordic HY bonds have performed after settlement, i.e. the behaviour of secondary prices once a new issue has entered the market.
Post-break performance reflects a mix of secondary demand and whether bonds were initially priced too tight or too wide in the primary market. Other factors may also matter, such as the extent to which arrangers support liquidity after settlement, or whether allocations in the bookbuilding process left some investors with too much or too little exposure. A deal dominated by a few large or short-term accounts (“bond flippers”) and priced with little concession is more likely to trade poorly after the break, particularly if arrangers are unable to provide aftermarket support. By contrast, a book with broad participation from long-term investors, granular allocations and more balanced pricing can generate stronger and more stable secondary performance, especially when arrangers help build liquidity after settlement.
For investors, understanding these dynamics is critical in assessing deal quality, execution standards and long-term risk–reward. With this framework in mind, we now turn to how this year’s bonds have performed across different dimensions.
For each deal, secondary prices were tracked post-settlement. Bonds were grouped by key characteristics (FX, size, issuer geography and issuer frequency). Within each group, we calculated the full distribution of outcomes: minimum, maximum, all deciles (10th through 90th), and the median. This enables comparisons of typical outcomes, skewness and extremes across groups.
Over time, we would normally expect most bonds to cluster slightly above par, with prices concentrated in the 100–105% range. Distressed cases will occasionally emerge, creating a small but visible tail at the lower end of the distribution. However, such cases rarely materialise in the first months after issuance, so a pronounced lower tail among recently priced bonds would be somewhat unusual.
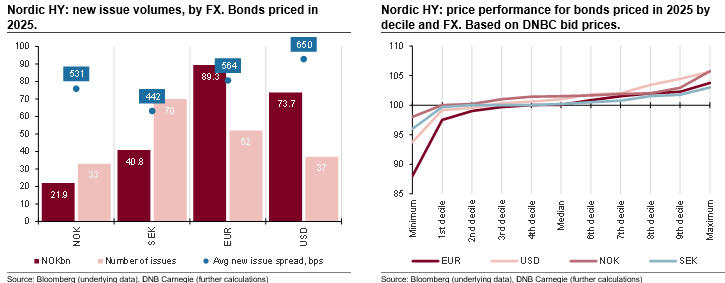
Let us first look at how bonds have performed by FX (foreign exchange). The Nordic HY market has long been dominated by bonds denominated in non-Nordic currencies. This reflects both issuers’ reliance on FX funding and the fact that Nordic investors have become accustomed to hedging FX exposure, recognising that this is necessary to attract participation from international accounts. These investors add depth and liquidity to the market and have become increasingly important in recent years, partly because of strong returns in Nordic HY, and partly because of limited supply in their own home markets.
In 2025, issuance has been led by EUR (NOK 89bn) and USD deals (NOK 74bn), while few NOK-denominated transactions have come to market (NOK 22bn). SEK issuance is more numerous but typically of smaller size, leaving total volume at just NOK 40bn.
New issue spreads have varied widely, averaging around 530bps in NOK, 440bps in SEK, 565bps in EUR and 660bps in USD. These differences reflect tenors (shorter in Sweden), sector mix (tight-priced real estate in SEK versus more generous pricing in offshore-related USD deals), and credit fundamentals such as ownership, earnings stability and leverage.
Price performance:
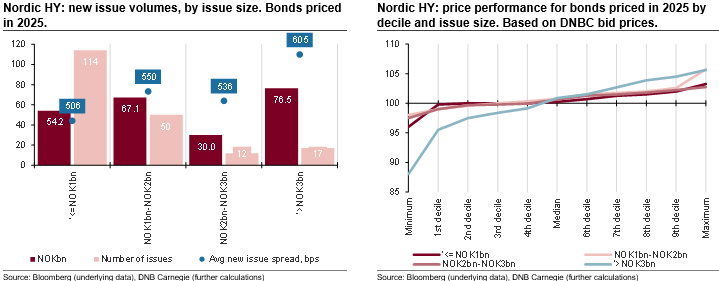
Next, we consider the role of issue size. Normally, larger issues would be expected to benefit from stronger liquidity, a broader investor base, and more feedback to arrangers — factors that should help produce more balanced pricing and terms. From this perspective, it would be natural to expect larger deals to perform better on the break, while smaller deals might appear more stable simply because they trade less in the secondary market.
In our sample, new issues are grouped into four buckets: below NOK 1bn, NOK 1–2bn, NOK 2–3bn, and above NOK 3bn. The distribution of deals is skewed towards the smaller categories, but in nominal terms the market is tilted towards the largest transactions. Somewhat surprisingly, average new issue spreads have been higher for the largest deals this year, reflecting a shift in the credit quality of the issuers tapping the market at that size. In particular, many of the riskiest EUR deals have increased in size this year, driving the average new issue spreads on large deals wider.
Price performance:
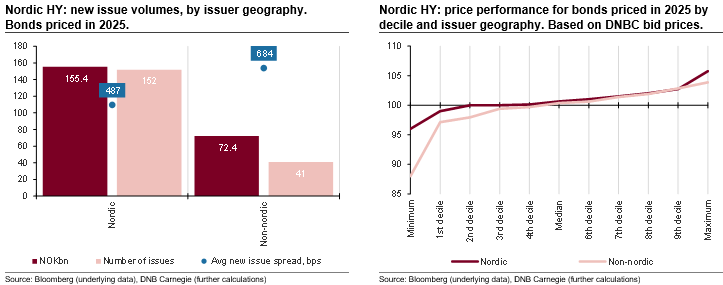
We next turn to geography, comparing Nordic and non-Nordic issuers. The Nordic market has historically attracted a wide range of international firms, particularly in offshore and shipping where local investors have built strong expertise. In recent years, however, the scope has broadened with non-Nordic issuers across a variety of industries increasingly tapping the market. Several structural features make the Nordic market attractive: transparent bond documentation, limited reliance on ratings (which reduces costs), and the role of Nordic Trustee in providing efficient administration and proven expertise in restructurings and defaults.
Historically, around 20% of new issue volumes have been raised by non-Nordic firms, but in recent years their share has risen to 30–40%. These deals also tend to be slightly larger and have offered a higher new issue spread (with the latter reflecting the premium associated with new issuers). In 2025, the average spread for non-Nordic issues has been about 680bps, compared to 490bps for Nordic issuers.
Price performance:
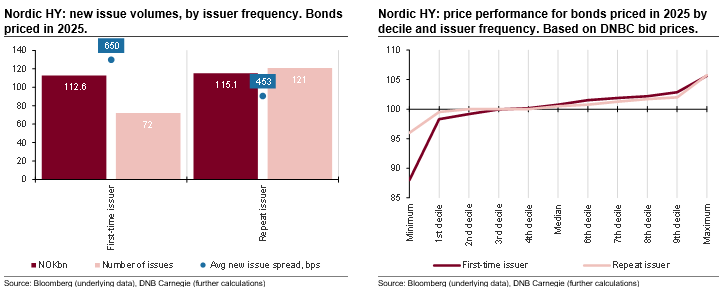
We can now look at whether there has been more volatility among first-time issuers compared to repeat issuers, as one might expect. Historically, the Nordic HY market has had a healthy mix of debut borrowers and established names. Over the past few years, however, the share of first-time issuers has increased significantly. As shown in the chart, debut transactions now account for around half of total deal volumes, a clear shift compared with the 2018–22 period when repeat issuers dominated. But while volumes are similar, the number of deals differs: 71 transactions from first-time borrowers versus 121 from repeat issuers. This reflects the larger average size of debut deals.
Another striking feature is the difference in pricing: average new issue spreads have been about 650bps for first-time issuers compared with 450bps for repeat issuers. This gap highlights the risk premium investors continue to demand when backing debut credits without an established track record in the bond market.
Price performance:
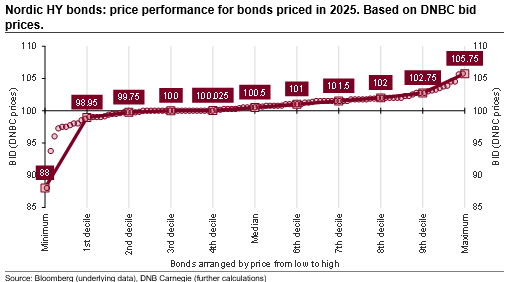
Overall, this year’s new issues have performed well in secondary markets. The median bond is now priced slightly above par at 100.5, while the 9th decile is at 102.75, underscoring the value of participating in primaries for most investors.
That said, there is a clear tail at the lower end. Our analysis suggests that this underperformance has been concentrated in large EUR-denominated deals, particularly where first-time issuers were involved. We cannot know for certain what drove these outcomes, but it is consistent with the dynamics often observed in bond markets: transactions that combine high-risk issuers with aggressive pricing and weaker bookbuilding characteristics tend to be more vulnerable to post-settlement weakness.
The broader lesson is that while the primary market continues to reward investors, selectivity remains key. Understanding fundamentals relative to terms and pricing, and being mindful of how the bookbuilding process has unfolded (and how similar deals have traded in the recent past) is critical. This is especially relevant in periods of heavy issuance, where investors have the ability to pick and choose among a wide set of opportunities.
Merk: Å kjøpe og selge aksjer innebærer høy risiko fordi verdien i verdipapirer vil svinge med tilbud og etterspørsel. Historisk avkastning i aksjemarkedet er aldri noen garanti for framtidig avkastning. Framtidig avkastning vil blant annet avhenge av markedsutvikling, aksjeselskapets utvikling, din egen dyktighet, kostnader for kjøp og salg, samt skattemessige forhold.
Innholdet i denne artikkelen er ment verken som investeringsråd eller anbefalinger. Har du noen spørsmål om investeringer, bør du kontakte en finansrådgiver som kjenner deg og din situasjon.